

Satellite Imagery Reveals the Extent of the Wildfires in South America
While the fire season in South America tends to start in July and peaks in September, the continent was already severely hit by wildfires in the early months of this year, with Chile, Venezuela, and Colombia particularly affected. The region saw record-high temperatures, reaching 37.3 °C in Santiago (Chile) and 40.4 °C in Colombia. This heat wave in central Chile was followed by wildfires, which claimed dozens of lives in February and covered more than 40,000 hectares. For comparison, this is equivalent to the area of Vilnius City Municipality.
Tracking wildfires from space
Satellite images of Venezuela, Brazil, and Argentina captured in January and February clearly depict active wildfires and smoke plumes. The red dots indicate the density of fires detected by the MODIS sensor on NASA’s Terra and Aqua satellites.
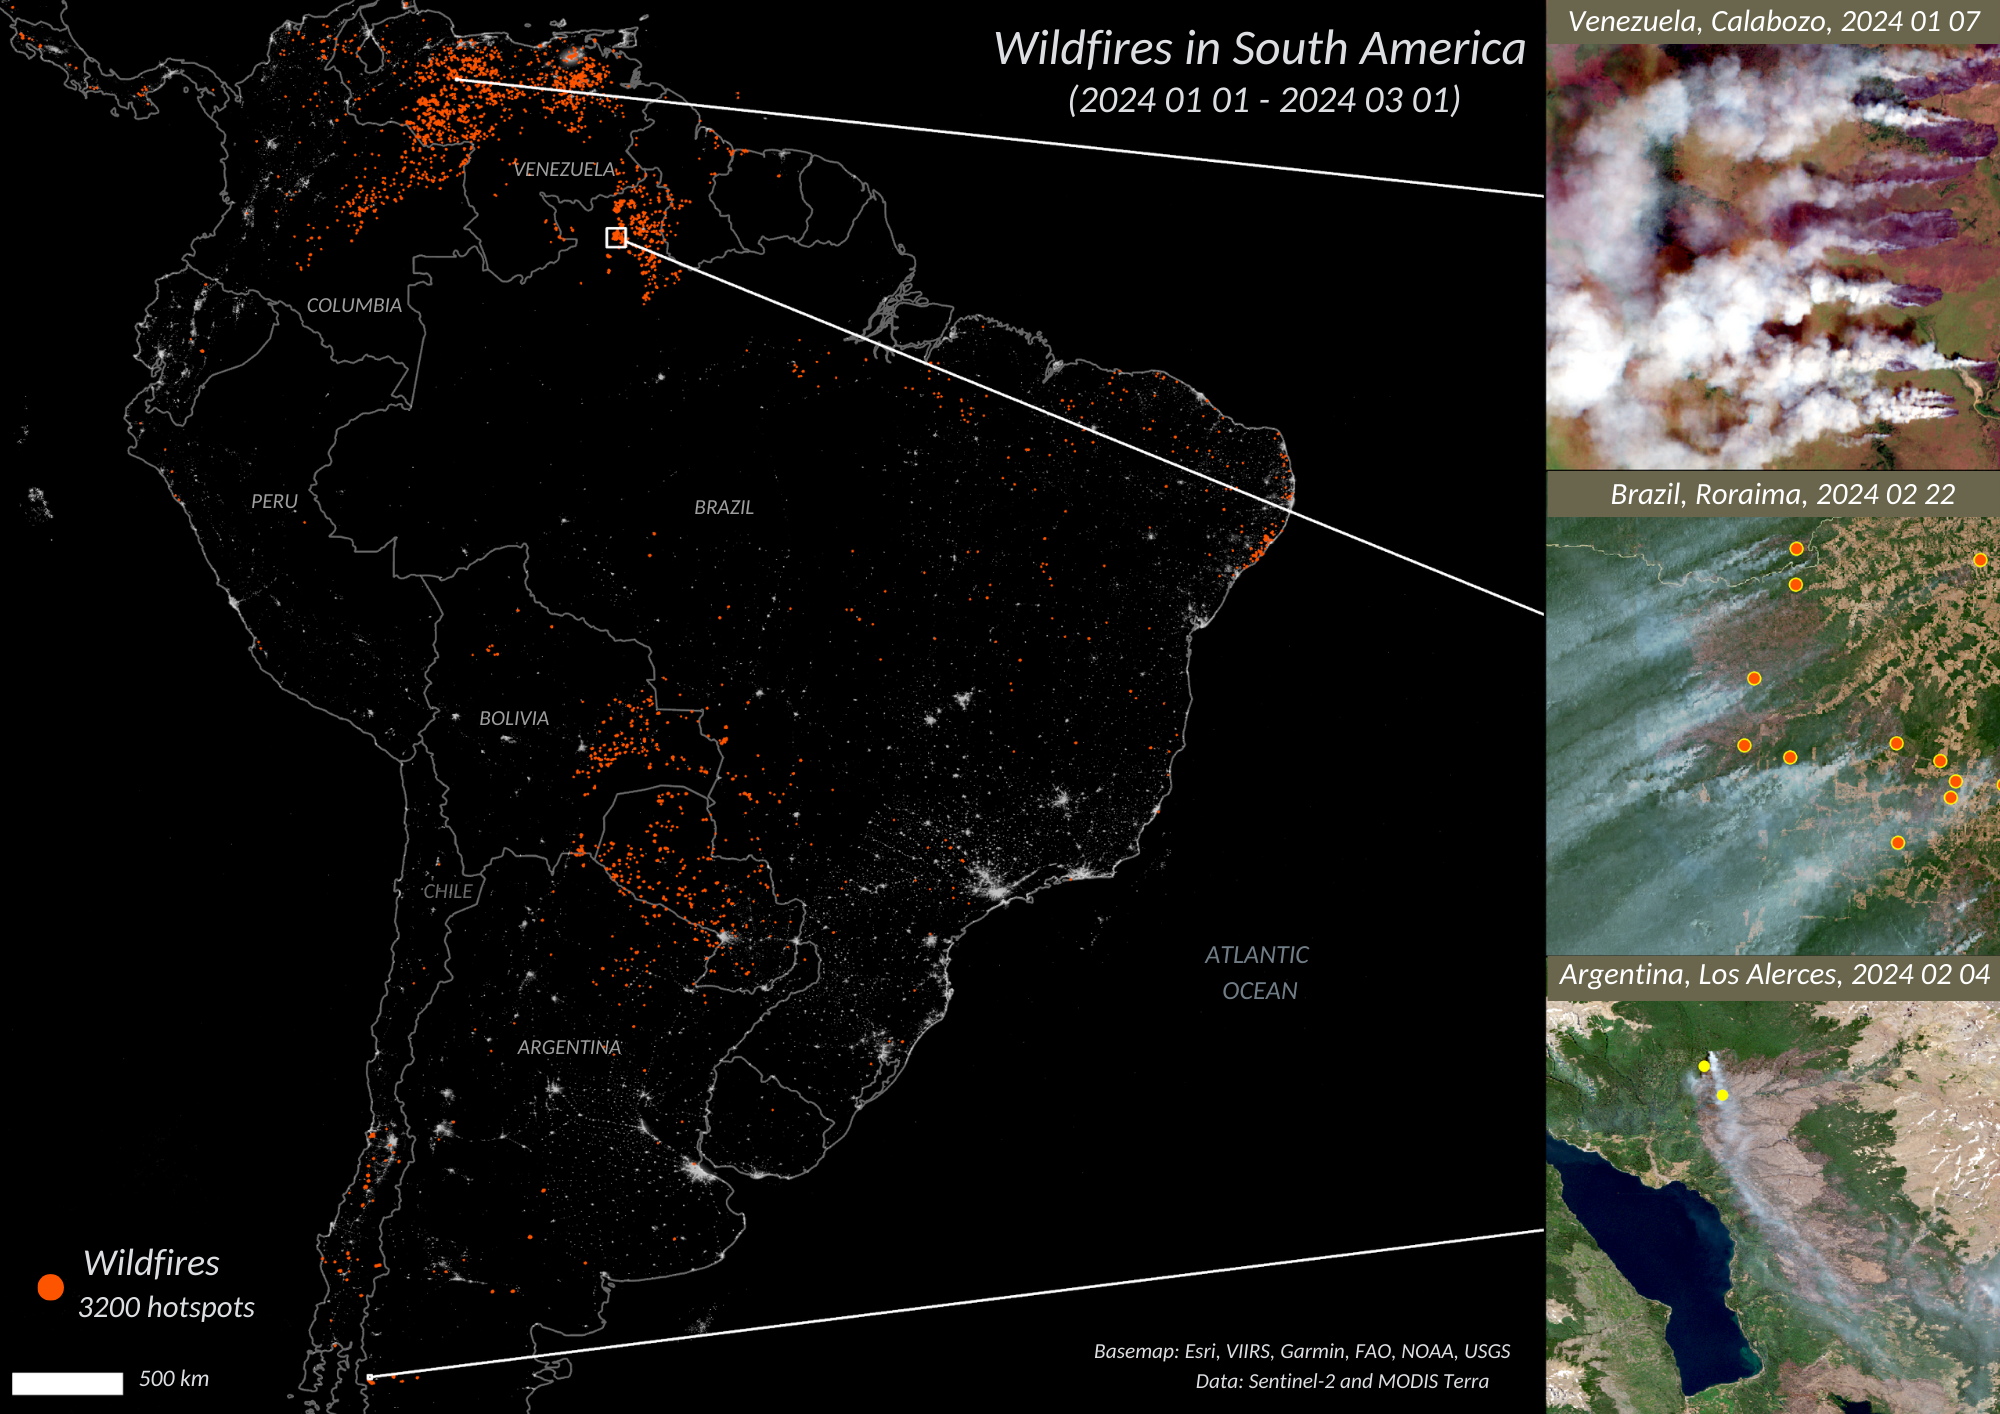
The MODIS sensors are medium-resolution spectroradiometers that have been operating successfully for more than 20 years and can collect data in 36 spectral bands (channels set at different wavelengths to capture images in various conditions), making them one of the most widely used sensors in the Earth sciences. MODIS can capture vast areas of wildfires with its thermal infrared sensors, similar to well-known thermal imagers. The map shows that until March, most of the wildfires raging in South America were concentrated in Colombia, Venezuela, Central Chile, and the state of Roraima in Brazil. The MODIS sensor detected a total of more than 3,000 wildfires spread across the continent during this period.
Wildfires in Chile – the deadliest on record
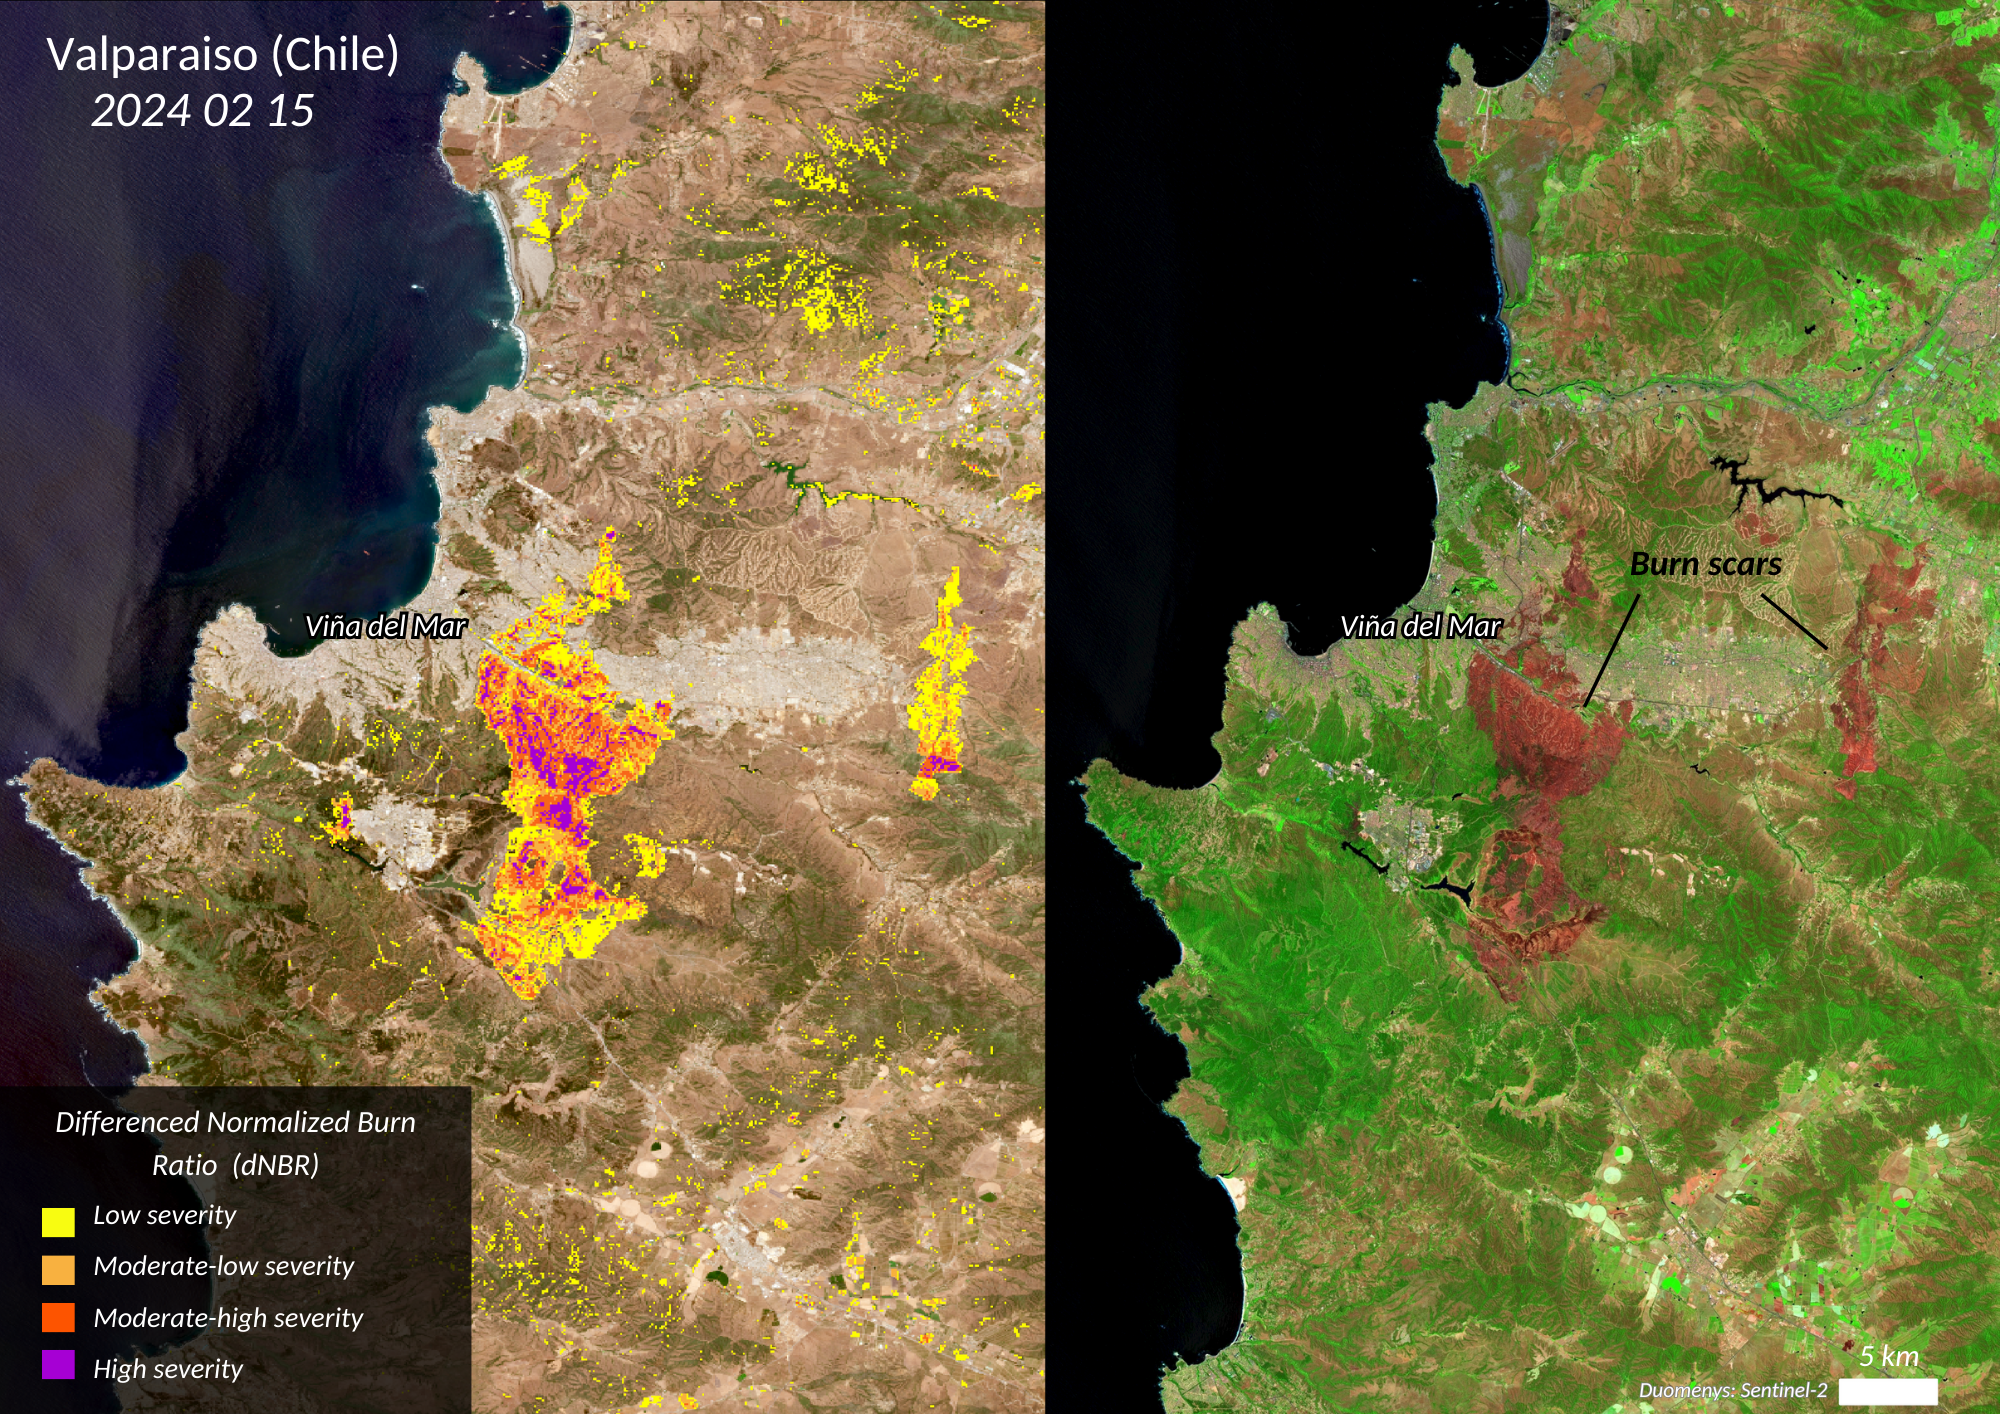
This February, the Valparaíso Region in Chile endured the deadliest wildfire in the country’s history. More than 100 casualties were recorded in the seaside city of Viña del Mar and its surroundings. Satellite data can help estimate the extent of the damage inflicted by wildfire. The most widespread method uses the so-called delta normalised burn ratio (dNBR). Pre-fire, healthy vegetation has very high near-infrared (NIR) reflectance and low reflectance in the short-wave infrared (SWIR) portion of the spectrum, yet these NIR reflectance values become low, and the SWIR values turn high after a wildfire has spread through an area. By comparing two dates – one before and one after a wildfire outbreak, the calculated difference may indicate the effect of its damage on the vegetation and surface. For example, using dNBR, we can calculate that the wildfires near Viña del Mar in early February scorched over 12,000 hectares of vegetation, shown in dark brown on the map.
The impact of El Niño
Extreme wildfires, usually associated with heatwaves and droughts, have got even worse in the Southern Hemisphere due to El Niño, which is part of the natural climate phenomenon called the El Niño Southern Oscillation (ENSO) – the interaction between the atmosphere and the ocean in the Pacific. Under normal conditions, the winds there blow west, with the western Pacific being warmer than its eastern basin. The La Niña phenomenon pushes moist and warm air even more strongly from South America towards Australia, while El Niño moves the warm water the other way around, i.e. eastward towards the Chilean coast. As a result, El Niño, the onset of which was declared in 2023, is currently causing heat waves in Chile but is expected to weaken as early as spring 2024. Although El Niño is likely to subside, there is already talk of a season susceptible to fires in other parts of the world, such as Australia and, eventually, the Northern Hemisphere, where the Mediterranean region and Canada were hit by wildfires last year.
Fires of this scale are dangerous not only because of the destructive flames but also due to the deteriorating air quality. Modern satellites monitor the Earth’s surface as well as track changes in the atmospheric composition. Sentinel-5P is one of the European Space Agency’s (ESA) newest satellites that have only been monitoring the Earth’s atmosphere since 2017; nevertheless, it has already made a significant contribution to mapping a multitude of trace gases – nitrogen dioxide (NO2), carbon monoxide (CO), sulfur dioxide (SO2), and aerosols. In the event of fires, increases in CO and aerosols are monitored by Sentinel-5P using UV and infrared sensors. Talking about Roraima state in northern Brazil, where wildfires spread in February, we can see a significant increase in CO concentrations.

High concentrations of CO and aerosols are harmful to human health and can cause respiratory diseases, while CO2 and other greenhouse gases emitted into the atmosphere by forest fires also contribute to climate change.